BIM-Tabular & Graphical Interactive Data Visualization


Description
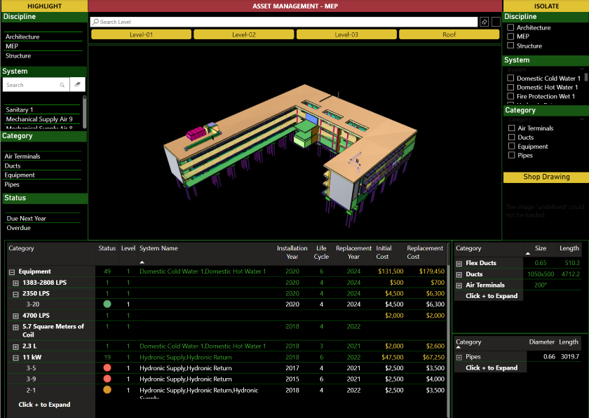
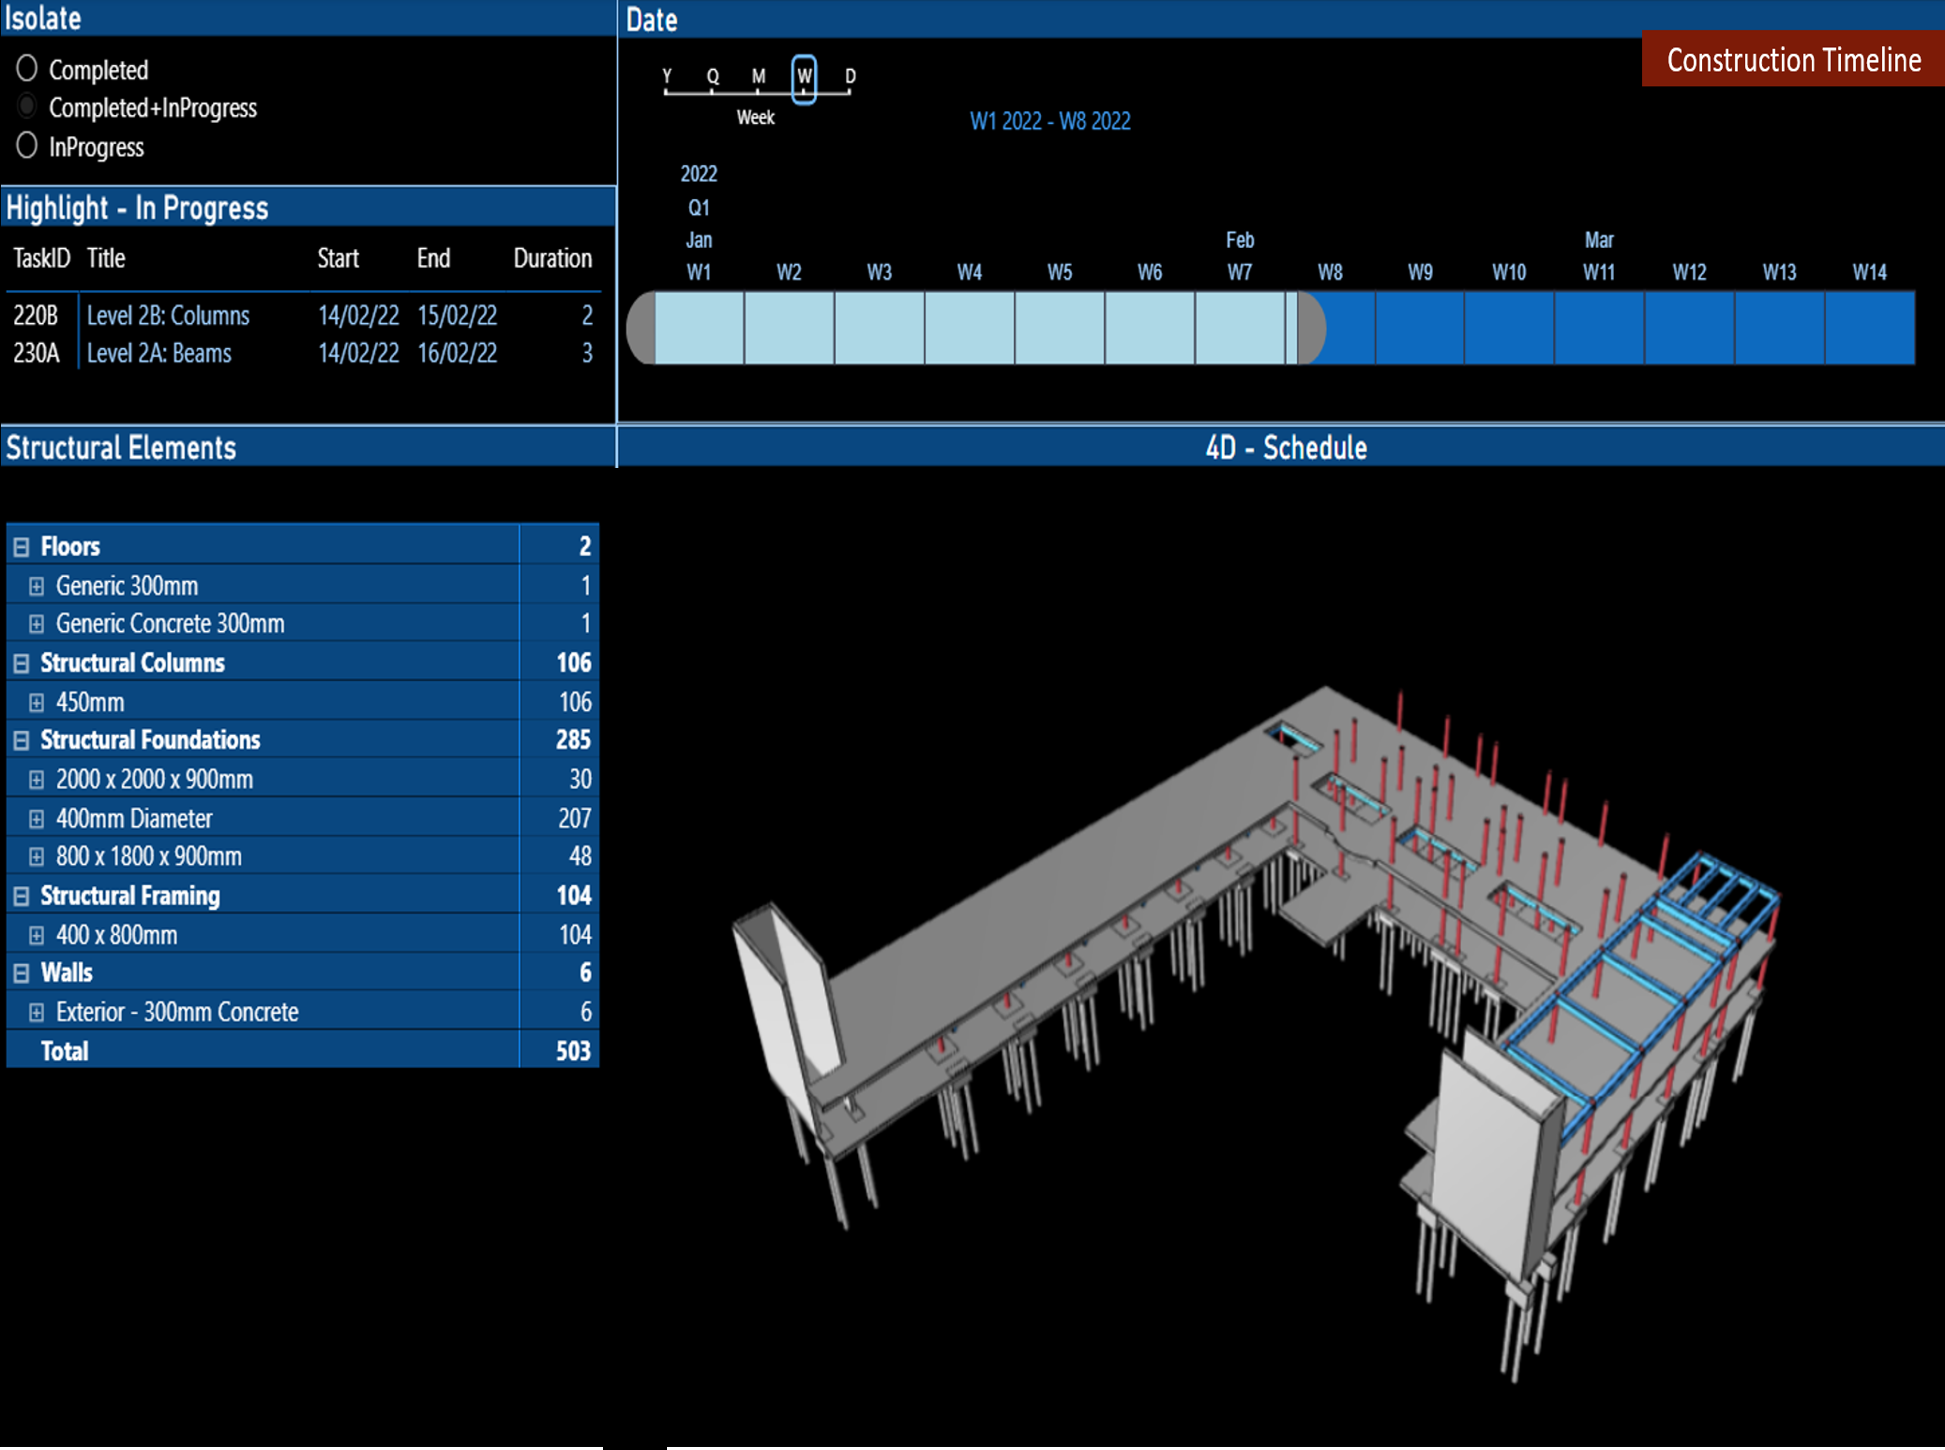
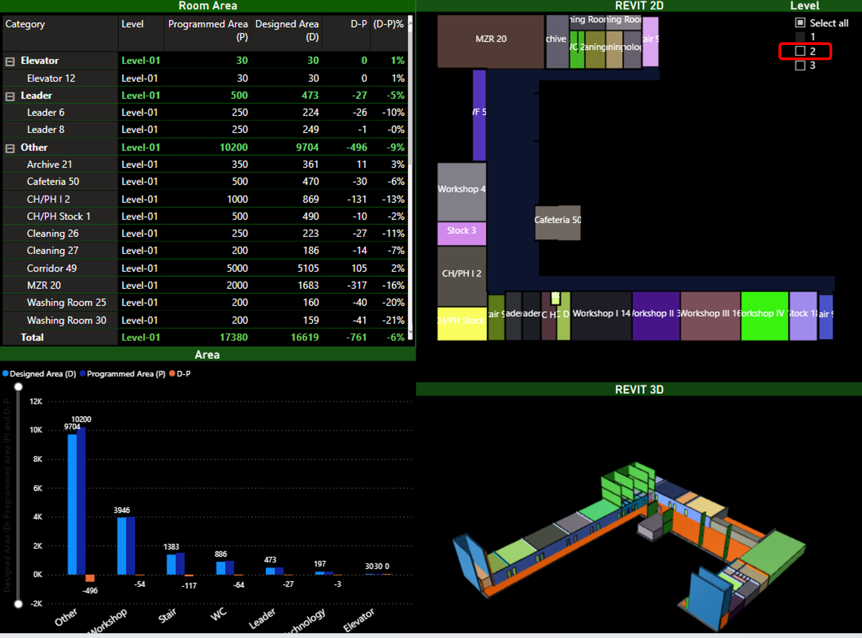
BIM-Tabular & Graphical Interactive Data Visualization
Transforming Data into Actionable Intelligence
At TD2 Group, we leverage the power of Power BI to create real-time, interactive dashboards and reports that provide deep insights into your operations. Our customized data visualization solutions help you:
Track Key Performance Indicators (KPIs)
Monitor Project Progress in Real Time
Make Data-Driven Decisions with Confidence
Why Choose TD2 Group for Data Visualization?
Interactive & Dynamic Visuals – Easily explore and analyze complex data.
Custom Solutions – Tailored to your industry and business needs.
Seamless Integration – Works across multiple platforms for accessibility.
State-of-the-Art Technology – Designed for clarity, efficiency, and insight.
Let us turn your data into intelligence that drives smarter decisions and better outcomes.
Contact us today to learn how our BIM-Tabular & Graphical Interactive Data Visualization solutions can empower your business!
Details
| Date Added | 2025-03-13 |
| Product Id | 10555065 |